Research Prototype · Data Pipeline
PrototypeKimchi Premium Threshold Strategy Validation Pipeline
I explored buy and sell thresholds using hourly price data, compared performance metrics, and extended the work into a pipeline that updates data hourly.
- Company
- Algorith Capital
- Service
- Kimchi Premium Research
- Period
- 2024.08–2024.11 · 4 months
- Role
- Backend / Data Prototype
- Responsibility
- Research · Backtest · Data Pipeline
- Team
- Solo
- Python
- pandas
- Jupyter
- Excel
- Google Drive API
- Bithumb · Yahoo Finance
Ownership
My direct responsibilities
- Documented the threshold-strategy hypothesis and experimental procedure based on fluctuations in the kimchi premium
- Cleaned hourly exchange-rate, BTC, and USDT price data for 2021–2024 and verified the kimchi premium (KPR) formula
- Calculated profit and loss for buy/sell threshold combinations, generated heatmaps, and compared risk-adjusted returns, gain-to-loss ratios, and buy-and-hold performance
- Automated hourly price updates using Yahoo Finance and Bithumb data, with uploads to Google Drive
- Implemented an Excel-based trading log structure separating funds, wallets, orders, and executions by strategy
Constraints
Constraints to address first
- Even for the same strategy, favorable thresholds varied by validation period, so a single result could not be generalized.
- I needed to align time zones and missing intervals in the price data and compare the results of the existing kimchi premium formula with a simplified formula.
- Backtest returns could differ from actual execution results because of fees, slippage, liquidity, and partial fills.
- The project was halted before live order automation was complete, so research and prototype work had to be distinguished from operational outcomes.
Implementation Timeline
I extended hypothesis testing into repeatable data updates
These stages were not independent tasks. The buy/sell thresholds from Phase 01 and the current kimchi premium from Phase 02 feed into Phase 03, where they come together in trading signals and per-strategy state records. Select a phase to see the problem identified at that stage and how it led to the architecture and verification criteria.
Threshold Backtesting
Phase 01
I selected threshold candidates through simulated trading and passed them on as strategy configuration values
The rules bought USDT when the kimchi premium crossed below a lower threshold and sold when it crossed above an upper threshold. I varied buy/sell thresholds in increments of 0.5 and calculated results with a 0.2% trading fee.
- 01
Data Alignment
I aligned the hourly USD/KRW, BTC/USDT, and BTC/KRW data and filled missing weekend intervals to build the 2021–2024 validation dataset.
Sample of Calculated Data After AlignmentDate Time BTC/KRW BTC/USDT USD/KRW Kimchi Premium USDT/KRW 2021-01-01 00:00 32,011,000 28,770.00 1,090.51 2.030% 1,112.65 2021-01-01 01:00 31,664,000 28,380.60 1,090.51 2.309% 1,115.69 2021-01-01 02:00 31,755,000 28,571.97 1,090.51 1.916% 1,111.40 These are the first 3 timestamps in the original 31,678-row Excel file, created by aligning the three price series to the same timestamps and filling missing values. - 02
Combination Search
I ran only combinations with a buy threshold below the sell threshold, calculated trade counts and cumulative profit and loss for each, and compared them in heatmaps.
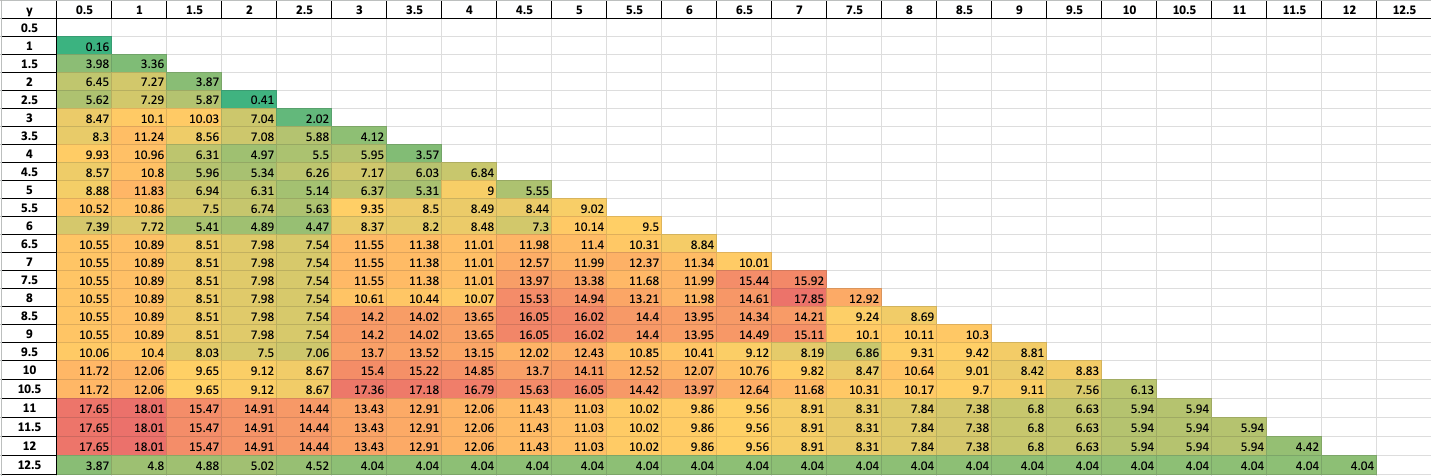
I varied buy/sell thresholds in increments of 0.5 to compare cumulative profit and loss in the marked-to-market value of simulated portfolios. - 03
Result Comparison
I updated simulated KRW and USDT balances and portfolio values at each time point to calculate per-trade and cumulative profit and loss, then compared risk-adjusted returns, gain-to-loss ratios, and buy-and-hold returns.
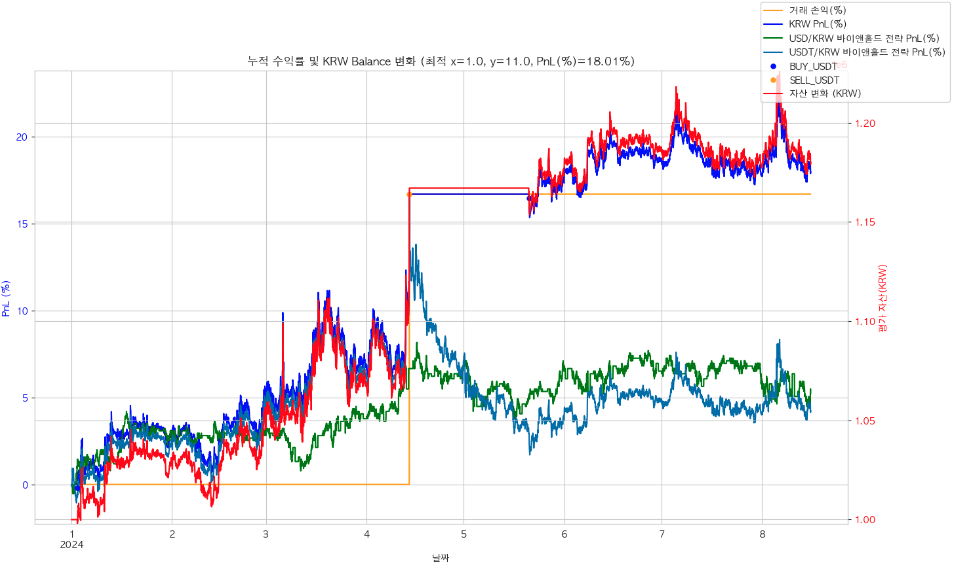
This shows hourly changes in cumulative profit and loss based on portfolio valuations from simulated trades using the selected threshold candidates. The chart's thresholds were those used for that experiment; candidates were adjusted during subsequent strategy configuration. Comparison of 2024 Validation ResultsComparison Cumulative Profit and Loss (PnL) Risk-Adjusted Return (Sharpe) Gain-to-Loss Ratio (GPR) Number of Trades Selected Threshold Candidate 18.01% 0.32 1.06 3 trades USD/KRW Buy and Hold 5.21% 0.13 1.02 – USDT/KRW Buy and Hold 4.25% 0.09 1.01 – These are reference results with overlapping periods for condition selection and validation, not actual investment performance.
Outcome
Verifiable outcomes
- Implemented a backtest calculating profit and loss and comparison metrics for threshold combinations using hourly price data
- Created result reports with return heatmaps and buy-and-hold comparisons to review strategy conditions
- Automated hourly price collection, merging with existing data, and loading to local storage and Google Drive
- Implemented per-strategy wallet, fund, order, and execution log schemas and exchange-response mapping
Limitations
Limitations and unimplemented scope
- This was not independent validation with fully separate backtest and strategy-condition selection periods.
- Some threshold values differ between the documentation and experiment artifacts, so I do not present an exact optimum as a headline outcome.
- Live order automation and recovery from partial fills and exchange failures remained incomplete because the project was halted.
- Update status was checked every hour, but gaps in exchange-rate data availability were not automatically filled.
- Backtest returns should not be interpreted as actual investment performance or risk-free arbitrage results.
Further reading
Explore the design decisions
Public reflections covering alternatives, trade-offs, and current judgments omitted from the summary.